Plot a survatr_result

Description

Base-R graphics rendering of survival / risk / RMST curves or of risk-difference / risk-ratio / RMST-difference contrasts. Dispatches on x$type:

  • survival / risk / rmst: one line per intervention (colored), CI ribbons when populated.

  • risk_difference / risk_ratio / rmst_difference: one line per contrast (colored), CI ribbons when populated, and a reference line at 0 (for differences) or 1 (for ratios).

Usage

## S3 method for class 'survatr_result'
plot(
  x,
  which = c("auto", "curves", "contrasts"),
  main = NULL,
  xlab = NULL,
  ylab = NULL,
  col = NULL,
  ribbon = TRUE,
  ribbon_alpha = 0.2,
  ...
)

Arguments

x A survatr_result.
which One of “auto”, “curves”, “contrasts”. “auto” picks curves for survival / risk / rmst and contrasts for the three pairwise types.
main Optional plot title.
xlab, ylab Optional axis labels. Sensible defaults are picked based on type.
col Optional vector of colors, length n_interventions (or n_contrasts). Defaults to grDevices::palette().
ribbon Logical; when TRUE and CI columns are populated, shade a polygon between ci_lower and ci_upper. Default TRUE.
ribbon_alpha Numeric in (0, 1); ribbon transparency (via grDevices::adjustcolor). Default 0.2.
Passed to the underlying plot.default() call.

Value

The survatr_result, invisibly.

See Also

Other survatr_result methods: contrast(), contrast.survatr_fit(), forrest(), forrest.survatr_result(), print.survatr_result(), tidy.survatr_result()

Examples

library("survatr")

set.seed(2)
n_id <- 40L
K <- 5L
pp <- data.frame(
  id = rep(seq_len(n_id), each = K),
  t = rep(seq_len(K), times = n_id),
  A = rep(rbinom(n_id, 1L, 0.5), each = K),
  Y = rbinom(n_id * K, 1L, 0.1)
)
fit <- surv_fit(pp, "Y", "A", ~1, "id", "t", time_formula = ~ factor(t))
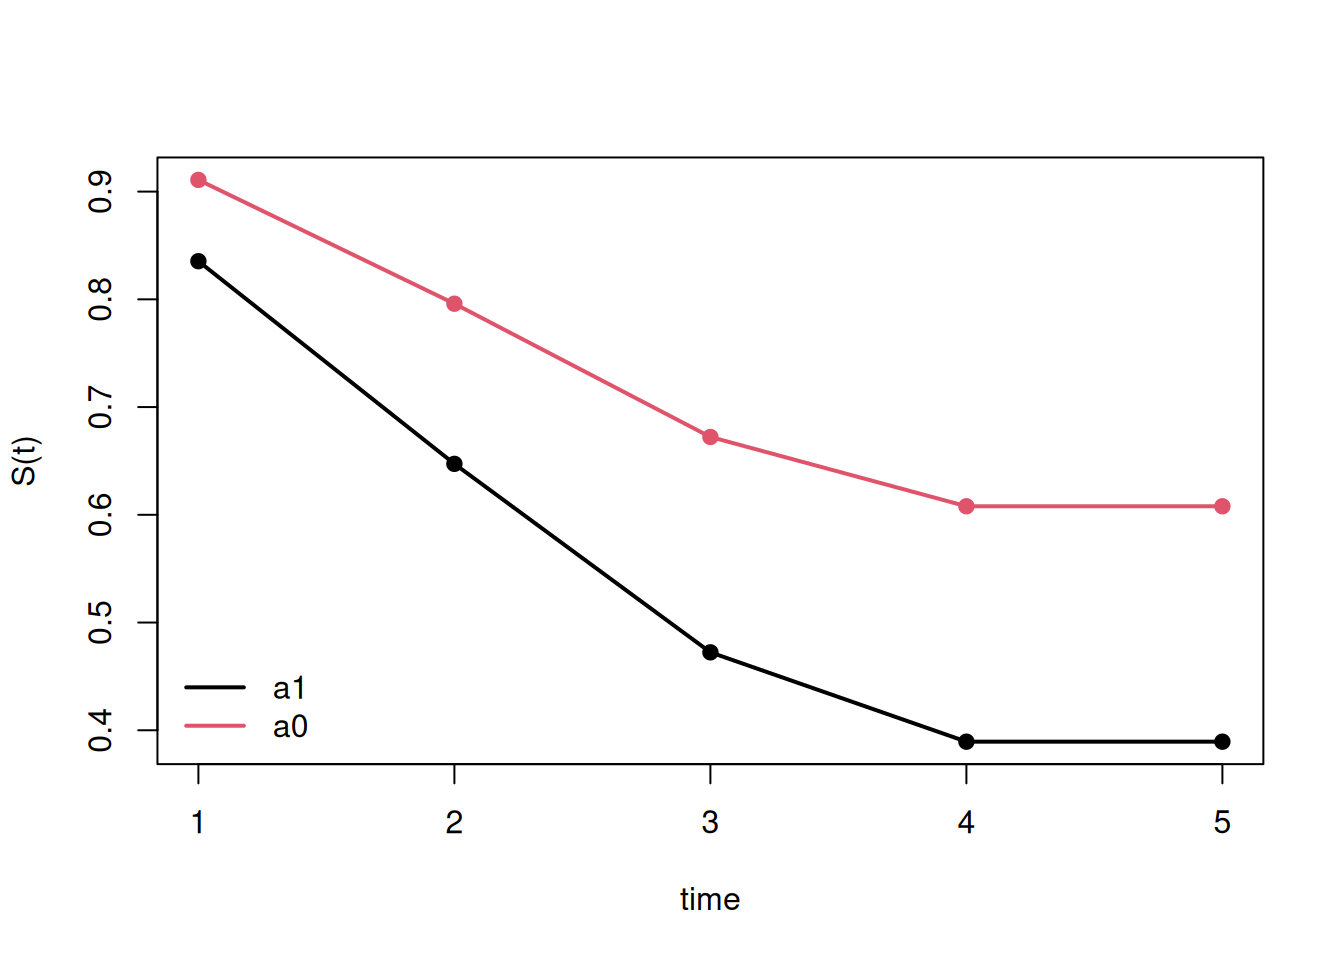
res <- contrast(
  fit,
  interventions = list(a1 = causatr::static(1), a0 = causatr::static(0)),
  times = 1:5,
  type = "survival"
)
plot(res)