---
title: "Competing risks with survatr"
code-fold: show
code-tools: true
vignette: >
%\VignetteIndexEntry{Competing risks with survatr}
%\VignetteEngine{quarto::html}
%\VignetteEncoding{UTF-8}
bibliography: references.bib
nocite: |
@young2014simcox
---
```{r}
#| include: false
knitr::opts_chunk$set(collapse = TRUE, comment = "#>")
set.seed(2026)
```
When an individual can fail from more than one mutually exclusive cause, a death
from cause B removes them from being at risk of cause A: the causes *compete*.
survatr handles this with **cause-specific hazards + cumulative incidence
functions (CIF)**. For $J$ competing event types it fits $J$ parallel
pooled-logistic cause-specific hazard models and builds, under each
intervention, the cause-$j$ cumulative incidence and the all-cause survival.
This vignette covers `surv_fit(competing = )`: the data layout, the CIF
estimands, the $\sum_j F^{(j)}(t) + S(t) = 1$ identity, contrasts with sandwich
inference, and the interpretational caveat that comes with cause-specific
contrasts. **Fine–Gray / subdistribution hazards are out of scope** — survatr is
cause-specific only.
## The model
For cause $j$, the cause-specific hazard on the at-risk person-period rows is
$$
\text{logit}\, h^{(j)}(t \mid A, L) = \alpha_j(t) + \beta_{A,j} A + \beta_{L,j} L .
$$
All $J$ models are fit on **one shared all-cause risk set** — an individual
leaves the risk set at the first event of *any* cause. That is exactly what
"treat the competing causes as censored at their event time" means, so you do
not build a separate risk set per cause. With the summed hazard
$H_{k} = \sum_j h^{(j)}_{k}$, the per-individual all-cause survival and cause-$j$
cumulative incidence are
$$
S_i(k) = \prod_{m \le k} (1 - H_{i,m}), \qquad
F^{(j)}_i(t) = \sum_{k \le t} S_i(k-1)\, h^{(j)}_{i,k},
$$
averaged across individuals (cumulate within id, then average — never average
hazards first). By construction $\sum_j F^{(j)}(t) + S(t) = 1$. This
cause-specific decomposition follows @hernan_whatif, Ch. 17.
## A two-cause data set
The event column is a single multi-valued integer: `0` = no event this period,
`1..J` = the cause of the event this period. Administrative censoring (if any)
goes in a separate `censoring` column, as elsewhere in survatr.
```{r}
#| message: false
library(causatr) # attach first so survatr's contrast() generic dispatches
library(survatr)
library(data.table)
sim_cr <- function(n = 3000L, K = 6L, seed = 1L,
h1 = 0.08, h2 = 0.05,
beta1_A = -0.5, beta1_L = 0.6, beta2_L = 0.3, gamma = 0.6) {
set.seed(seed)
L <- rnorm(n)
A <- rbinom(n, 1L, plogis(gamma * L)) # L confounds A
l1 <- qlogis(h1)
l2 <- qlogis(h2)
rows <- vector("list", n)
for (i in seq_len(n)) {
p1 <- plogis(l1 + beta1_A * A[i] + beta1_L * L[i])
p2 <- plogis(l2 + beta2_L * L[i])
ev <- integer(K)
done <- FALSE
for (k in seq_len(K)) {
if (done) next
u <- runif(1L) # multinomial: (no event, cause 1, cause 2)
if (u < p1) {
ev[k] <- 1L
done <- TRUE
} else if (u < p1 + p2) {
ev[k] <- 2L
done <- TRUE
}
}
rows[[i]] <- data.table(
id = i, t = seq_len(K), A = A[i], L = L[i], event = ev
)
}
rbindlist(rows)
}
pp <- sim_cr()
head(pp)
```
## Fitting
Pass the multi-valued column to **both** `outcome` and `competing` (they name the
same column). Competing risks is a point-treatment g-computation estimator in
this release.
```{r}
fit <- surv_fit(
pp,
outcome = "event",
treatment = "A",
confounders = ~ L,
id = "id",
time = "t",
competing = "event",
time_formula = ~ factor(t)
)
fit
```
The fit holds one cause-specific hazard model per cause:
```{r}
names(fit$cause_models)
fit$causes
```
## Cumulative incidence under two interventions
`type = "cif"` returns the per-cause cumulative incidence for every cause (a
`cause` column distinguishes them). `cause = ` selects a subset.
```{r}
ivs <- list(treat = causatr::static(1), control = causatr::static(0))
times <- c(2L, 4L, 6L)
cif <- contrast(fit, ivs, times = times, type = "cif")
cif$estimates
```
All-cause survival comes from the summed hazards (`type = "survival"`), and the
identity holds:
```{r}
surv <- contrast(fit, ivs, times = times, type = "survival")
ident <- merge(
cif$estimates[, .(fsum = sum(cif_hat)), by = .(intervention, time)],
surv$estimates[, .(intervention, time, s_hat)],
by = c("intervention", "time")
)
ident[, total := fsum + s_hat][]
```
## Contrasts and sandwich inference
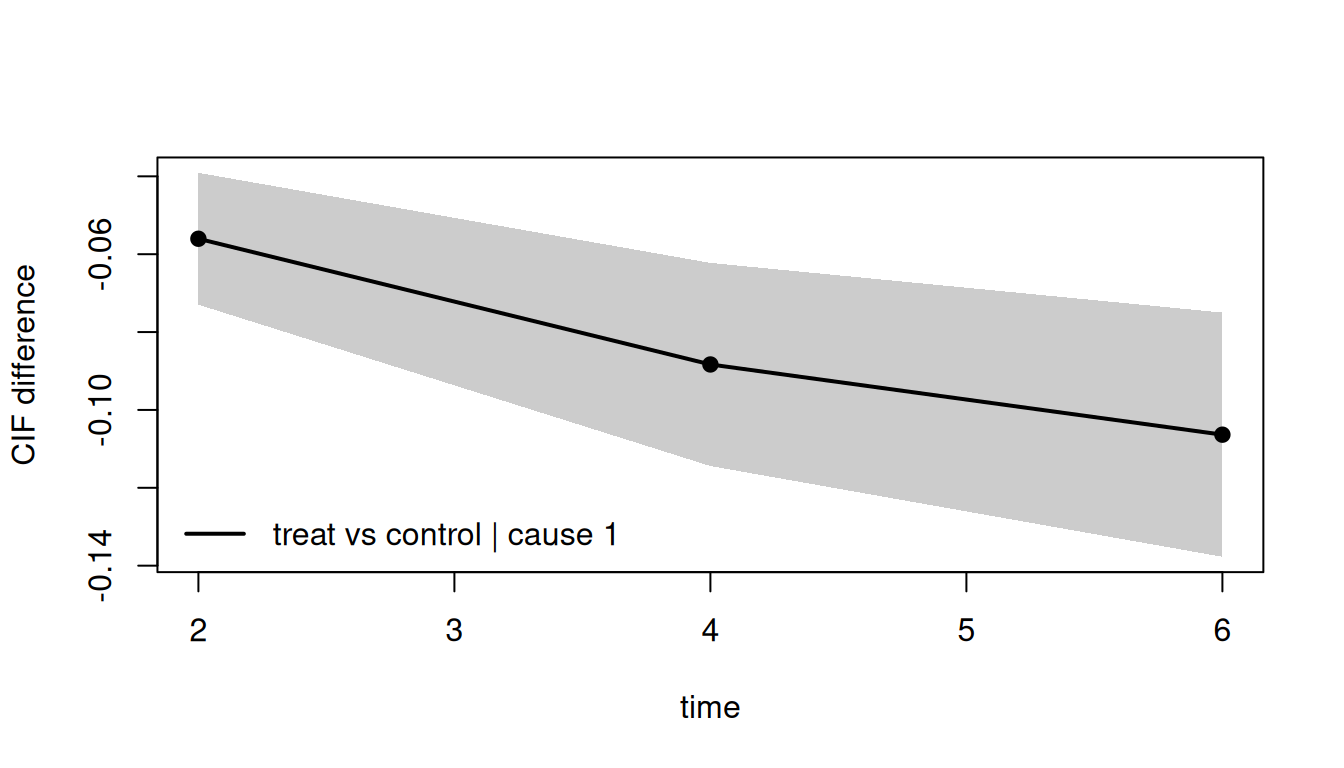
`cif_difference` and `cif_ratio` contrast a cause's cumulative incidence between
interventions. The stacked-EE sandwich propagates the uncertainty in all $J$
cause-specific models through the CIF.
```{r}
rd <- contrast(
fit, ivs,
times = times,
type = "cif_difference",
cause = 1L,
reference = "control",
ci_method = "sandwich"
)
rd$contrasts
```
```{r}
#| fig-width: 7
#| fig-height: 4
plot(rd)
```
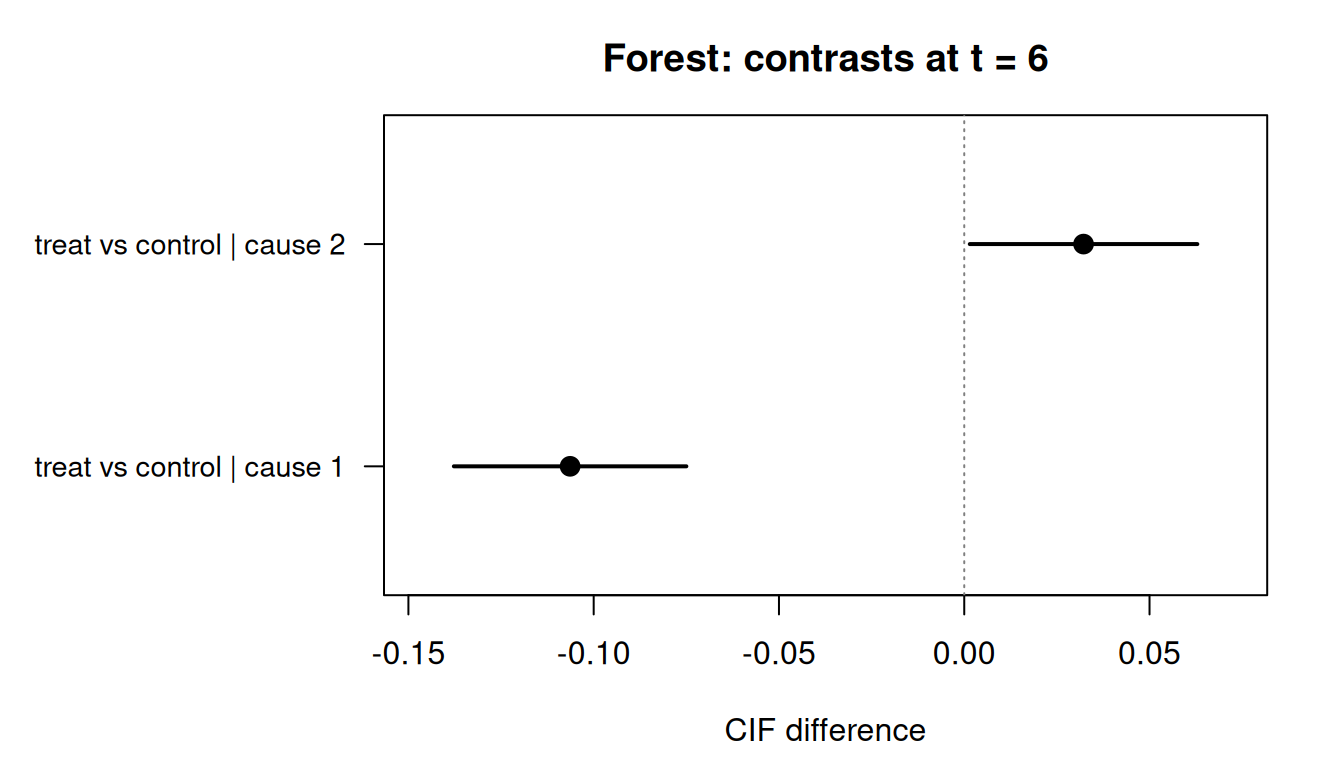
A forest plot at a reference time shows every cause's contrast at once:
```{r}
#| fig-width: 7
#| fig-height: 4
rd_all <- contrast(
  fit, ivs,
  times = times,
  type = "cif_difference",
  reference = "control",
  ci_method = "sandwich"
)
forrest(rd_all, t_ref = 6)
```
## Years of life lost
Per-cause **years of life lost** up to $t^*$ is the integral of the cause-$j$
cumulative incidence, $\mathrm{YLL}^{(j),a}(t^*) = \int_0^{t^*} F^{(j),a}(u)\,du$
[@andersen2013yll].
It carries the same `cause` dimension as the CIF (and the same truncation-by-
death caveat), and the per-cause years lost add up to the all-cause restricted
mean time lost: $\sum_j \mathrm{YLL}^{(j),a}(t^*) = \mathrm{RMTL}^a(t^*)$.
```{r}
#| cache: true
yll <- contrast(fit, ivs, times = times, type = "yll", ci_method = "sandwich")
yll$estimates[time == max(times)]
## The per-cause years lost sum to the all-cause restricted mean time lost.
rmtl <- contrast(fit, ivs, times = times, type = "rmtl")
merge(
yll$estimates[time == max(times), .(yll = sum(yll_hat)), by = intervention],
rmtl$estimates[time == max(times), .(intervention, rmtl_hat)],
by = "intervention"
)
```
## A caveat: truncation by death
A cause-specific CIF contrast is a **total** effect on cause-$j$ incidence: it
mixes the effect on the cause-$j$ hazard with the effect on the competing
hazards (which change who survives to be at risk of cause $j$). It is *not* a
contrast that holds the competing process fixed, and it conditions on surviving
the competing events — the classic "truncation by death" problem. survatr emits
this caveat once per session and repeats it when you print a `cif_difference` /
`cif_ratio` result. Interpret per-cause contrasts accordingly, and report the
all-cause survival alongside them.
## Scope and rejections
- **Cause-specific hazards only.** Fine–Gray / subdistribution hazards (a
different estimand and data structure) are out of scope.
- **Point-treatment g-computation only this release.** `estimator = "ipw"` or
`"ice"` with `competing = ` aborts (`survatr_competing_estimator`);
longitudinal and IPW competing risks ship in later chunks.
- **`competing` must name the same column as `outcome`**, with at least two
distinct positive causes (else `survatr_competing_misuse`), and hold
non-negative integer cause codes (else `survatr_bad_competing`).
- **Estimand / fit must match:** a CIF estimand needs a competing-risks fit and
a single-event contrast (e.g. `rmst_difference`) is not defined for one
(`survatr_competing_type`).
- **Per-cause RMST / years-of-life-lost** (the integral of the CIF) is deferred
to a later estimands chunk.
## References
::: {#refs}
:::