Code
library(causatr)
library(tinytable)
library(tinyplot)library(causatr)
library(tinytable)
library(tinyplot)Most interventions assign treatment as a function of covariates — static(1) ignores everything, dynamic(rule) reads the covariate history, shift(δ) nudges the observed value. Natural-history modified treatment policies (G-LMTPs; (Díaz et al. 2026)) are different: the treatment assigned at time t depends on the natural value of treatment — the treatment a patient would take absent the intervention — at t and at earlier periods.
The motivating example is a grace period or delay: “postpone treatment initiation by one period relative to when the patient would naturally start.” To even define that intervention you need the patient’s natural initiation time, which is a counterfactual quantity.
This vignette explains what these policies are, why they cannot be written as dynamic() rules, how causatr estimates them with an augmented-data sequential regression, and how the estimator relates to LMTPs and to natural-value IPW.
Write \(A_t\) for treatment at period t and \(L_t\) for time-varying covariates. Under a longitudinal regime d, the natural value \(A_t(\bar A^d_{t-1})\) is the treatment that would be observed at t if the intervention were stopped just before t, given the regime was followed through t−1. It is the formal version of “what the patient would do on their own.”
shift(), scale_by(), threshold() are of this kind.The cleanest way to see the difference is to follow one patient whose natural (untreated-course) treatment path initiates at period 3 and stays on (absorbing): \(\bar A = (0, 0, 1, 1, 1)\).
nat <- c(0, 0, 1, 1, 1) # natural / observed treatment path
traj <- rbind(
  data.frame(t = 1:5, A = nat, policy = "natural (observed)"),
  data.frame(t = 1:5, A = rep(1, 5), policy = "static(1)"),
  data.frame(t = 1:5, A = c(0, 0, 0, 1, 1), policy = "grace_period(1)"),
  data.frame(t = 1:5, A = rep(nat[1], 5), policy = "carry_forward()")
)
with(traj, tinyplot(
  A ~ t | policy,
  type = "b", pch = 19,
  ylab = "treatment", xlab = "period",
  main = "Assigned treatment under each policy"
))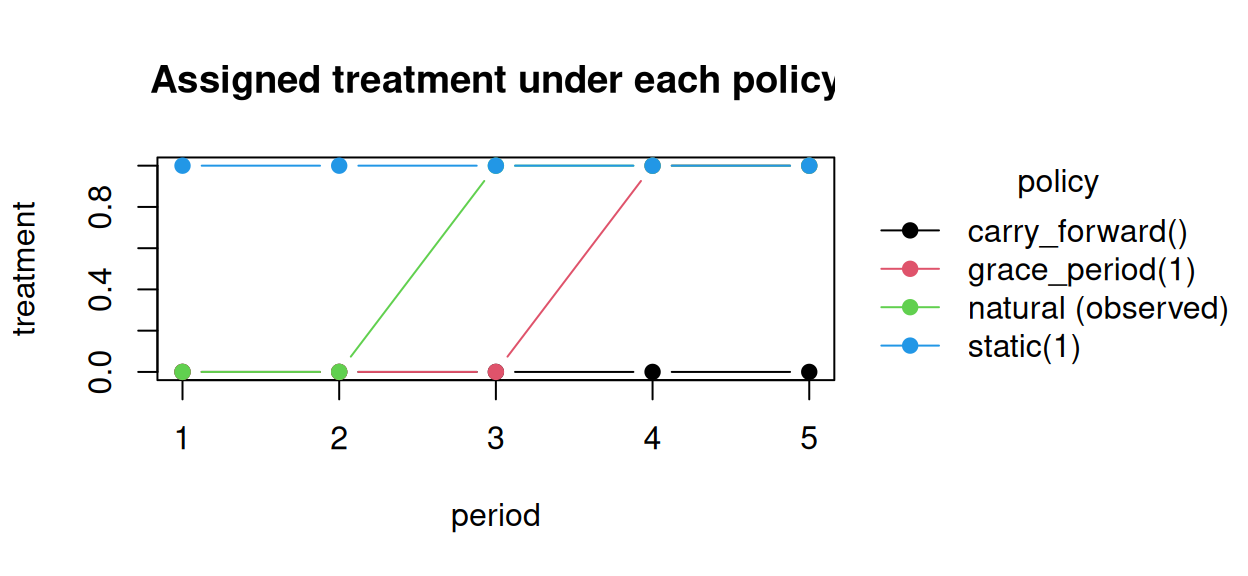
static(1) ignores the natural value; grace_period(1) delays the natural initiation by one period; carry_forward() freezes everyone at their baseline level (here 0).
static(1) and carry_forward() are flat — they do not read the natural value. grace_period(1) tracks the natural path but shifted one period later: that delay is the estimand. Crucially, the delay is defined relative to the patient’s own (counterfactual) initiation time, which is exactly what makes it a natural-history policy.
dynamic() ruleIt is tempting to write the delay as dynamic(\(data, trt) data$lag1_A) — “set this period’s treatment to last period’s.” This is wrong, and it fails silently. causatr’s ICE recursion conditions on the observed lagged treatment (lag1_A), but under the delay the natural value at t differs from the observed value the moment the policy has perturbed the trajectory (treatment-state feedback). The rule runs without error and returns a number — just the wrong causal estimand.
Here is the gap on a simulated absorbing-treatment process with covariate feedback (so the natural history under the regime genuinely diverges from the observed history):
set.seed(1)
n <- 2500L
tau <- 4L
L0 <- rnorm(n)
A <- matrix(0L, n, tau)
L <- matrix(0, n, tau)
Lprev <- L0
Aprev <- integer(n)
for (t in seq_len(tau)) {
  Lt <- if (t == 1L) 0.5 * L0 + rnorm(n) else 0.5 * Lprev + 0.8 * Aprev + rnorm(n)
  At <- ifelse(Aprev == 1L, 1L, rbinom(n, 1L, plogis(-1 + 0.5 * Lt)))
  A[, t] <- At; L[, t] <- Lt; Lprev <- Lt; Aprev <- At
}
Y <- 1 + 0.8 * rowSums(A) + 0.4 * L[, tau] - 0.5 * L0 + rnorm(n)
d <- data.frame(
  id = rep(seq_len(n), each = tau), time = rep(seq_len(tau), n),
  L0 = rep(L0, each = tau), A = as.vector(t(A)), L = as.vector(t(L)),
  Y = NA_real_
)
d$Y[d$time == tau] <- Y

fit <- causat(
  d, outcome = "Y", treatment = "A",
  confounders = ~ L0, confounders_tv = ~ L,
  id = "id", time = "time", estimator = "gcomp", history = Inf
)
#> Warning: `model_fn` not specified; defaulting to `stats::glm`.
#> ℹ Set `model_fn` explicitly (e.g. `model_fn = stats::glm` or `model_fn = mgcv::gam`).

# Correct: natural-history engine.
mu_grace <- contrast(
  fit, list(delay1 = grace_period(1L)),
  ci_method = "bootstrap", n_boot = 100L
)$estimates$estimate[1]

# Wrong: a dynamic() rule that reads the OBSERVED lag.
naive <- dynamic(function(data, trt) {
  v <- data$lag1_A; v[is.na(v)] <- 0L; v
})
mu_naive <- contrast(
  fit, list(naive = naive), ci_method = "bootstrap", n_boot = 2L
)$estimates$estimate[1]

c(grace_period = mu_grace, naive_dynamic_lag = mu_naive)
#>      grace_period naive_dynamic_lag
#>          2.281738          1.003515
On this data generating process the true one-period-delay mean is ≈ 2.30; the augmented engine recovers it to within ~1%, while the naive dynamic(lag1_A) rule is off by tens of percent. The tests/testthat/test-glmtp.R suite pins this against the forward-simulation truth and replicates the Díaz et al. (2026) Section-6 delay result.
The standard sequential-regression g-formula breaks for these policies: at a backward integration step it would need to set one past treatment to two values at once — the value it conditions on (in \(P(a_{t+1}\mid a_t)\)) and the value the policy feeds forward (in \(d_{t+1}(\dots, a_t)\)).
The fix (the paper’s augmented data) is to decouple the two. Each observation is replicated once per possible natural-treatment-history sequence \(\bar s_t\), which is carried as a label through the backward recursion:
| original row | natural-history label \(\bar s_t\) | response used |
|---|---|---|
| patient i | \((0, 0)\) | \(q_{t+1}((0,0), A_{t+1,i}, H_{t+1,i})\) |
| patient i | \((0, 1)\) | \(q_{t+1}((0,1), A_{t+1,i}, H_{t+1,i})\) |
| patient i | \((1, 0)\) | \(q_{t+1}((1,0), A_{t+1,i}, H_{t+1,i})\) |
| patient i | \((1, 1)\) | \(q_{t+1}((1,1), A_{t+1,i}, H_{t+1,i})\) |
A separate outcome model is fit per label (so the conditioning value and the policy-input value never collide), then the policy is applied at prediction time. causatr’s parametric plug-in is \(\sqrt n\)-consistent under correct specification, with ID-cluster bootstrap inference. The treatment lag columns keep their observed values (they are the conditioning history); only the label carries the counterfactual natural history — that decoupling is the whole trick.
grace_period(window) delays initiation; carry_forward() holds everyone at their baseline level. Both need a longitudinal g-computation fit with a discrete treatment, and use the ID-cluster bootstrap.
res <- contrast(
  fit,
  interventions = list(
    delay1 = grace_period(1L),
    locf = carry_forward(),
    natural = NULL
  ),
  reference = "natural",
  ci_method = "bootstrap", n_boot = 200L
)
tt(res$estimates)| intervention | estimate | se | ci_lower | ci_upper |
|---|---|---|---|---|
| delay1 | 2.281738 | 0.03665249 | 2.209763 | 2.359176 |
| locf | 2.059251 | 0.04147649 | 1.975603 | 2.153217 |
| natural | 2.946063 | 0.03767625 | 2.864486 | 3.016399 |
est <- res$estimates
with(est, tinyplot(
  x = factor(intervention, levels = intervention), y = estimate,
  ymin = ci_lower, ymax = ci_upper,
  type = "pointrange", ylab = expression(E(Y^d)), xlab = ""
))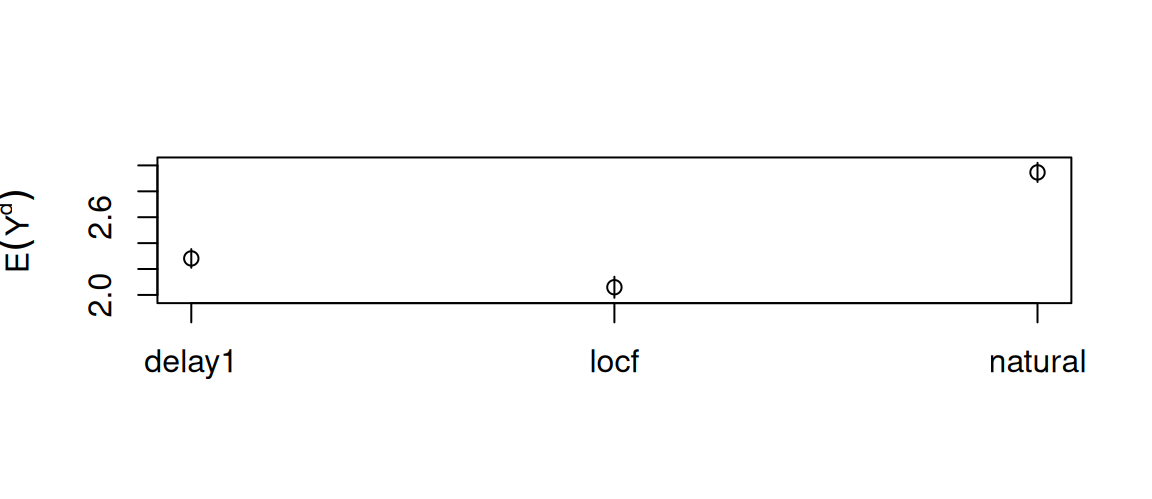
Delaying initiation lowers the counterfactual mean relative to the natural course (fewer treated person-periods); carry-forward (hold at baseline) lowers it further.
Natural-value interventions have a lineage. The table below places the causatr G-LMTP engine alongside the standard LMTP framework and the original IPW treatment.
| Young et al. (2014) | LMTP (Díaz et al. 2023) | G-LMTP (Díaz et al. 2026) | |
|---|---|---|---|
| Policy reads | natural value (foundational) | contemporaneous natural value \(A_t\) + \(H_t\) | natural-value history \(\bar A_t\) + \(H_t\) |
| Estimation | IPW (density ratio \(g^d/g\)) | g-comp / IPW / doubly-robust TMLE/SDR | augmented-data sequential regression |
| In causatr | IPW engine (shift/scale_by/ipsi) |
IPW engine | gcomp engine (grace_period/carry_forward) |
Two practical points:
lmtp is not a valid oracle here. The lmtp package applies its shift once to the observed data, computing the standard LMTP — which differs from the natural-history target whenever the policy has perturbed the trajectory. The correct reference is forward Monte-Carlo simulation of the natural-history regime (the paper’s Proposition 1), which the test suite uses.shift() / scale_by() are the continuous MTPs); the augmented engine handles binary and ordinal/count. Multivariate (vector-valued) treatment is also rejected (causatr_glmtp_multivariate): the paper develops the augmentation for a scalar exposure only, and a joint discrete support would enumerate the joint cardinality raised to the number of periods — intractable, and the limitation the paper’s own conclusion flags.grace_period() / carry_forward() are rejected under IPW / AIPW / matching and for point treatments.ci_method = "bootstrap" (ID-cluster) and ci_method = "sandwich" (analytic per-(step, label) M-estimation) are supported.cap_escalation()) and other nonlinear ordered policies are estimated consistently once the dose enters the per-step model flexibly — see Flexible dose models below.By default the treatment enters every per-step outcome model as a bare numeric main effect. For a binary treatment that is exactly saturated, but for an ordered / ordinal dose a single linear slope can misspecify a non-monotone or kinked counterfactual response — the canonical case being a dose-escalation cap, whose policy is piecewise-linear in the dose. The bare-numeric plug-in then carries a small but persistent asymptotic bias even though the augmented recursion is exactly correct.
cap_escalation(delta) is the natural-history policy for exactly this case: it caps the per-period increase of the natural dose at delta, comparing the natural dose at \(t\) with the natural dose at \(t-1\). treatment_form lets the dose enter the per-step model via a transformed term, while the policy still sets the numeric dose column — only the model’s design term changes. Here is a worked example on an ordinal dose {0, 1, 2} that escalates over three periods:
set.seed(2)
n <- 2000L; tau <- 3L; m <- 2L           # dose levels {0, 1, 2}
L0 <- rnorm(n)
dose <- matrix(0L, n, tau); L <- matrix(0, n, tau)
Lprev <- L0; Aprev <- integer(n)
for (t in seq_len(tau)) {
  Lt <- 0.5 * Lprev + 0.3 * Aprev + rnorm(n)
  step <- rbinom(n, 2L, plogis(-0.2 + 0.6 * Lt))
  At <- pmin(m, Aprev + step)            # natural dose escalates, capped at 2
  dose[, t] <- At; L[, t] <- Lt; Lprev <- Lt; Aprev <- At
}
Y <- 1 + 0.7 * rowSums(dose) + 0.4 * L[, tau] - 0.5 * L0 + rnorm(n)
dose_data <- data.frame(
  id = rep(seq_len(n), each = tau), t = rep(seq_len(tau), n),
  L0 = rep(L0, each = tau), dose = as.vector(t(dose)),
  L = as.vector(t(L)), Y = NA_real_
)
dose_data$Y[dose_data$t == tau] <- Y

fit_cap <- causat(
  dose_data, outcome = "Y", treatment = "dose",
  confounders = ~ L0, confounders_tv = ~ L,
  id = "id", time = "t", estimator = "gcomp", history = Inf,
  treatment_form = ~ factor(dose)        # each dose level its own coefficient
)
#> Warning: `model_fn` not specified; defaulting to `stats::glm`.
#> ℹ Set `model_fn` explicitly (e.g. `model_fn = stats::glm` or `model_fn = mgcv::gam`).
res_cap <- contrast(
  fit_cap,
  interventions = list(cap1 = cap_escalation(1), natural = NULL),
  reference = "natural", ci_method = "bootstrap", n_boot = 100L
)
tt(res_cap$estimates)| intervention | estimate | se | ci_lower | ci_upper |
|---|---|---|---|---|
| cap1 | 4.100219 | 0.03991312 | 3.995161 | 4.156022 |
| natural | 4.181199 | 0.03954115 | 4.079189 | 4.234457 |
Capping the per-period escalation at one level lowers the counterfactual mean relative to the natural course (a capped patient accrues fewer high-dose periods). With ~ factor(dose) each dose level carries its own coefficient, so the kinked capped-dose response is recovered to sampling error rather than fit through one slope; the bare-numeric default would instead carry a small but seed-stable bias when the cap binds. Lag terms expand automatically (factor(dose) → factor(lag1_dose)). The flexible term is longitudinal-g-computation-only and benefits standard ICE regimes (static / shift / dynamic) as much as natural-history policies. Under factor(dose) an intervention must keep the dose within the observed levels (a new level makes prediction fail); splines::ns(dose, df) extrapolates smoothly.